The Same 51.5 Total Isn’t Always the Same Game
Three Thursday night college football games share a 51.5 total with completely different scoring expectations. We’re testing whether game structure changes how the live total moves.
Three college football games Thursday night share the same betting total: 51.5.
That makes them look similar on the board.
They are not.
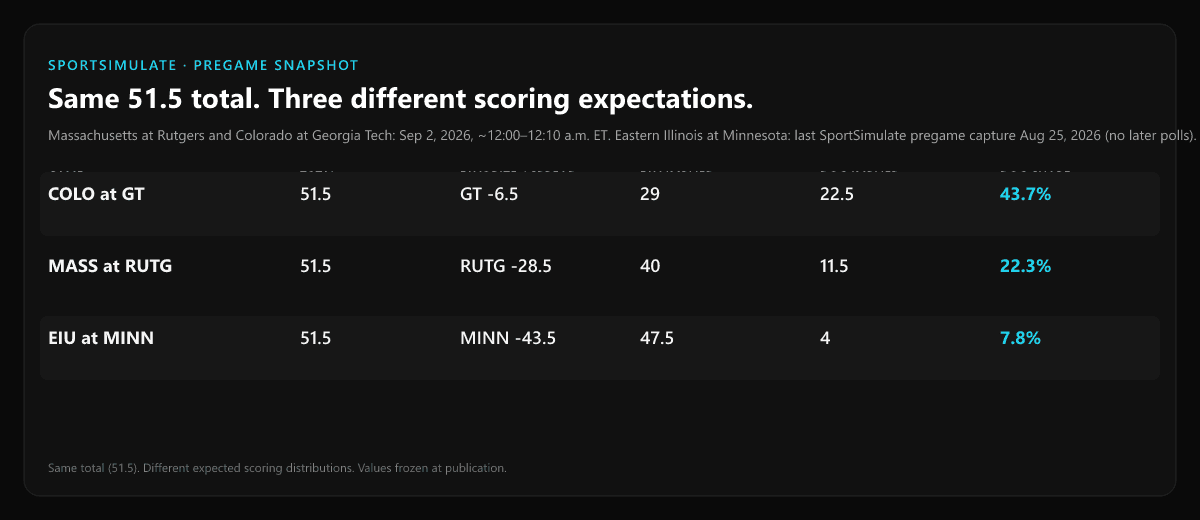
Colorado at Georgia Tech is expected to be competitive. Rutgers is expected to dominate Massachusetts. Minnesota is favored by more than 40 points over Eastern Illinois.
Same total. Completely different expectations for how those 51.5 points are supposed to happen.
That gives us a useful question to test with SportSimulate:
Same number, different games
Start with Colorado at Georgia Tech.
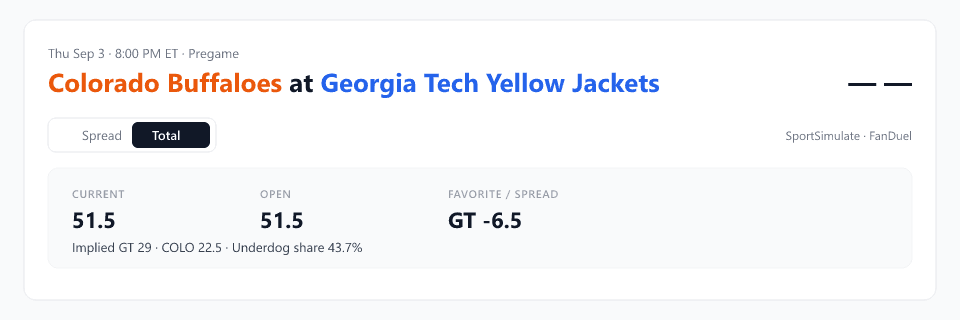
Georgia Tech is favored by 6.5 with a total of 51.5, which produces an implied score of roughly 29-23.
Both teams are expected to score. Colorado, the underdog, accounts for about 44% of the projected points.
If this game turns into a shootout, there are several ways it can happen. Georgia Tech can outperform expectations. Colorado can outperform expectations. Both offenses can produce. A close game can create more aggressive play and more meaningful possessions late.
GT -6.5 | Total 51.5 | Implied: GT 29, Colorado 22.5
Now compare that with Massachusetts at Rutgers.
The total is also 51.5.
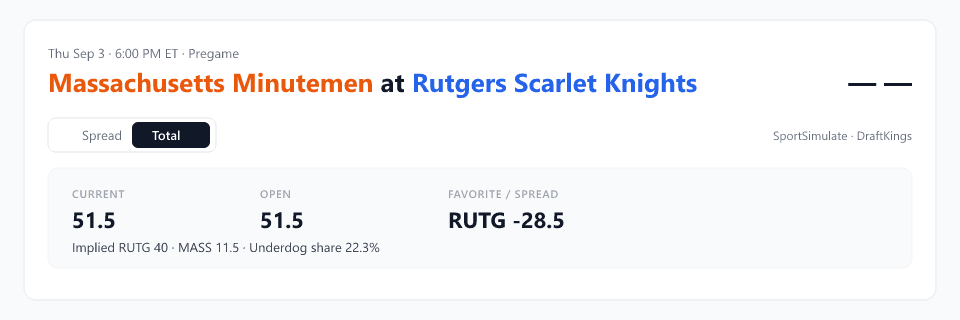
But Rutgers is favored by roughly four touchdowns, giving us an implied score around 40-12.
The market isn’t expecting two offenses to combine evenly for 52 points. It’s expecting Rutgers to do most of the work.
Rutgers -28.5 | Total 51.5 | Implied: Rutgers 40, UMass 11.5
Then there’s Eastern Illinois at Minnesota.
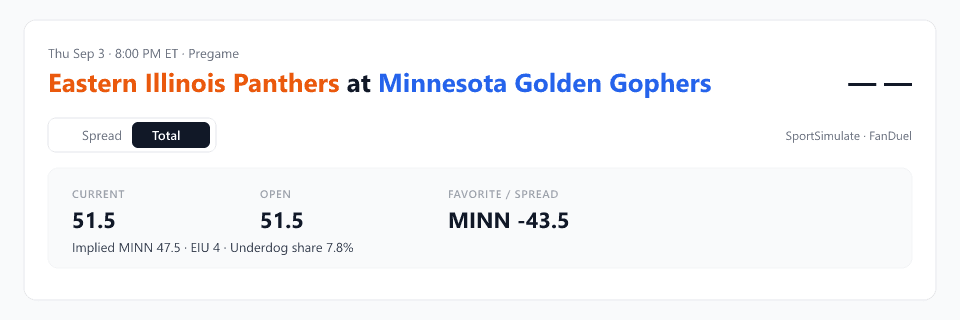
Minnesota is favored by more than 40 points. The implied score is roughly 48-4.
Almost the entire total belongs to Minnesota.
Minnesota -43.5 | Total 51.5 | Implied: Minnesota 47.5, EIU 4
So when we say all three games have a total of 51.5, we’re really describing three different bets:
- A game where both teams are expected to contribute
- A game where the favorite is expected to carry most of the scoring
- A game where the favorite is expected to carry almost all of it
That distinction becomes more interesting once the games begin.
What happens when the live total moves?
Suppose all three live totals climb from 51.5 to 57.5.
On the surface, it’s a similar six-point move.
SportSimulate can measure that move in exactly the same way across all three games.
But the story behind it may be very different. And how or if to bet would be different.
In Colorado at Georgia Tech, a six-point jump might mean both offenses are outperforming expectations and the market now sees a faster, more competitive game.
In Rutgers vs UMass, it may mean Rutgers is scoring faster than expected.
Or maybe UMass scores twice early. That would matter because the market barely expected the Minutemen to contribute in the first place.
That effect becomes even more extreme with Eastern Illinois.
If Minnesota is expected to score nearly everything, an unexpected Eastern Illinois touchdown could change the live total far more than its seven points would suggest.
The scoreboard changed by seven.
The expected structure of the game changed by much more.
That’s what we’re interested in.
The SportSimulate hypothesis
SportSimulate currently evaluates total movement using the same strategy framework across the slate.
That’s intentional.
Before building increasingly complicated models, we want evidence that additional complexity actually improves anything.
Thursday gives us a simple test.
One possibility is that a six-point move is basically a six-point move. Once the market has accounted for the score, time remaining and game conditions, the original distribution between favorite and underdog may not matter very much.
If that’s true, a universal threshold may be exactly what we want.
The other possibility is that the same move carries different information depending on the type of game.
A six-point increase in a competitive game may behave differently from a six-point increase in a game where one team was expected to score 90% of the points.
And the most important number might not even be the spread.
That’s an important distinction.
A 35-point favorite in a game with a total of 72 isn’t necessarily the same betting environment as a 35-point favorite with a total of 48.
The spread tells us the expected margin.
The implied team totals tell us where the scoring is expected to come from.
What we’ll watch Thursday night
We aren’t changing the SportSimulate strategy during the games.
The rules are locked before kickoff. Then we’ll watch what happens.
The three 51.5 games are the main comparison because they start with the same combined scoring expectation.
We’ll also track the rest of Thursday’s eight-game slate for additional context.
The important questions are straightforward:
We’ll also compare what the market expected with what actually happens.
A projected blowout might stay close into the fourth quarter.
A competitive game might be over by halftime.
That matters because live betting is ultimately about updating expectations as reality replaces the pregame forecast.
What would make this interesting?
This isn’t enough data to declare that we’ve discovered a new betting model.
Three games can’t do that.
What they can do is tell us whether there’s something worth investigating.
If all three totals behave similarly despite dramatically different game structures, that’s useful information. It argues against adding unnecessary complexity.
If they behave very differently — particularly if those differences repeatedly connect to who is scoring and how the game is unfolding — then we have a reason to test the idea across a much larger sample.
That is how SportSimulate is intended to work.
Not by declaring that every market movement is a betting opportunity.
By showing the movement, connecting it to the game, generating measurable signals and then determining whether those signals actually hold up.
Why publish this before kickoff?
Because explanations are easy after the game.
If Minnesota wins 63-3 and the total explodes, we could invent a theory afterward explaining why it was obvious.
If Colorado at Georgia Tech turns into a 17-13 defensive game, we could do the same thing in reverse.
Publishing the idea first forces us to live with the question we actually asked.
Thursday night, we’ll track the line movement, the SportSimulate strategy triggers and the game situations behind them.
Three games.
Three identical totals.
Three very different expectations.
Now we get to see whether the live market treats them that way too.